
ELK stack is consists of three applications i.e. Elasticserach, Logstash, and Kibana to retrieve and manage log files. This allows you to search all the logs in a single place which helps in identifying problems with servers or applications. The ELK stack is developed and maintained by the company named Elastic.
Today in this article we will show you the steps to install and use ELK stack on a Ubuntu system.
Prerequisites
To follow this guide you should have the following –
- A computer system running a recent version of Ubuntu (I will use Ubuntu 20.04 LTS)
- Access to a user account with sudo privileges
- Java 8 or 11 should be installed on your system
Install dependencies
You have to install a few dependencies this includes Nginx and Java. ELK is based nginx-based so if you already have an apache web server installed make sure to disable it and install Nginx.
You also need to install Java which is required by Logstash you can check if it is already installed or not by using the given command.
java --versionThis will display the Java version if it is installed on your system otherwise it will suggest you install Java.
Open your terminal and execute the given command to install all the dependencies required by ELK on your system –
sudo apt install openjdk-11-jre apt-transport-https wget nginxType y and then press the enter when it asks for your confirmation.
Add Elastic repository
To download all the applications in the ELK stack you need to enable Elastic repository on your system.
So first use the following command to import the Elastic’s GPG key –
wget -qO - https://artifacts.elastic.co/GPG-KEY-elasticsearch | sudo apt-key add -Use the following command to add Elastic’s repository to the repository list on your system –
echo "deb https://artifacts.elastic.co/packages/7.x/apt stable main" | sudo tee –a /etc/apt/sources.list.d/elastic-7.x.listFinally, run the given command to update the repository on your system –
sudo apt updateInstall and configure Elasticsearch
Elasticsearch is used for storing logs. Use the following command to install it on your system –
sudo apt install elasticsearch -yOnce it gets installed use your preferred text editor and edit its configuration –
sudo nano /etc/elasticsearch/elasticsearch.ymlHere find and uncomment the given lines –
#network.host: 192.168.0.1#http.port: 9200And replace the network.host IP with your own address to expose this node to a network –
network.host: localhosthttp.port: 9200Add the following line in the discovery section of this file –
discovery.type: single-node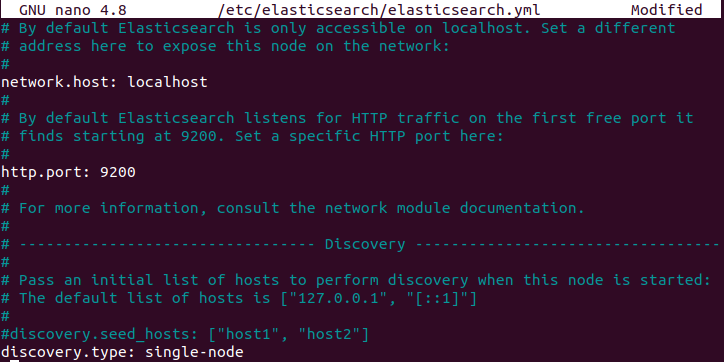
Save this file and exit from the editor.
Start and enable Elasticsearch
Now start and enable the Easticserach services by using the given command –
sudo systemctl start elasticsearch.servicesudo systemctl enable elasticsearch.serviceInstall and configure Kibana
Kibana is a graphical user interface for parsing and interpreting collected log files. Use the following command to install Kibana on your system –
sudo apt install kibana -yOnce it gets installed use your preferred text editor and edit its configuration –
sudo nano /etc/kibana/kibana.ymlFind and uncomment server.port, server.host and elasticsearch.host and modify it as given below –
server.port: 5601server.host: "localhost"elasticsearch.hosts: ["http://localhost:9200"]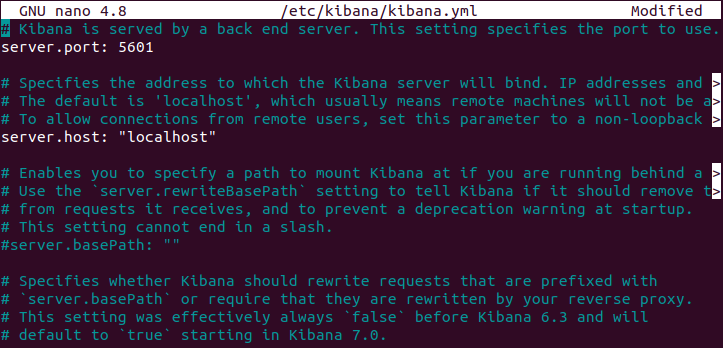
Save this file and exit from the editor.
Start and enable Kibana
Use the following command to start and enable Kibana services on your system –
sudo systemctl start kibanasudo systemctl enable kibanaModify your firewall settings
If the UFW firewall is enabled on your system you need to allow traffic on port 5601 to access the Kibana dashboard.
Use the following command to allow traffic on port 5601 –
sudo ufw allow 5601/tcpInstall Logstash
Logstash tool collects and processes logs. To install it on your system you need to use the following command in your terminal –
sudo apt install logstash -yOnce it gets installed use the following command to start and enable it –
sudo systemctl start logstashsudo systemctl enable logstashYou can check the status of the service by using the given command.
sudo systemctl status logstash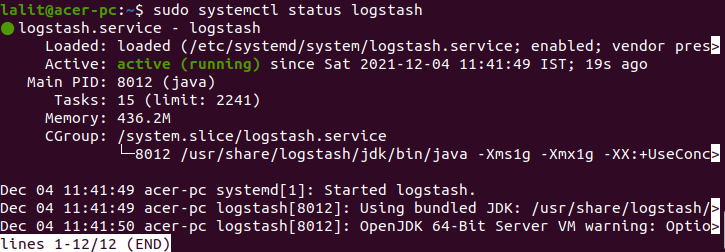
Install Filebeat
Filebeat is a lightweight plugin used to collect and ship log files. It monitors the log files or locations that you specify, collects log events, and forwards them either to Elasticsearch or Logstash for indexing.
Now use the following command to install Filebeat on your system –
sudo apt install filebeat -yFilebeat, by default, sends data to Elasticsearch. By editing /etc/filebeat/filebeat.yml file you can also configure it to send event data to Logstash.
Now enable the Filebeat system module, it will examine local system logs –
sudo filebeat modules enable systemStart and enable Filebeat services
Use the following command to start and enable the Filebeat services –
sudo systemctl start filebeatsudo systemctl enable filebeatAccess the Kibana dashboard
Open a browser and enter the address that you assigned to Kibana.
http://localhost:5601You will see the given page –
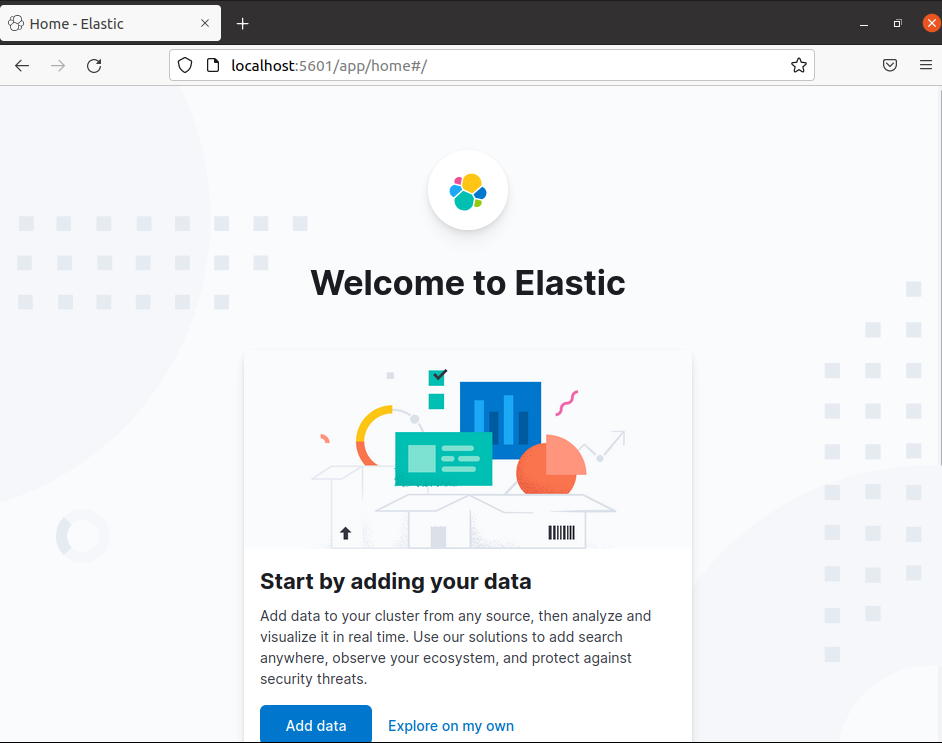
Now here you can click on Add data or Explore on my own and add data to your cluster from any source then you can analyze and visualize it in real-time in your browser.
Conclusion
Ok, so you have successfully set up ELK stack on your Ubuntu system. Now if you have a query then write us in the comments below.